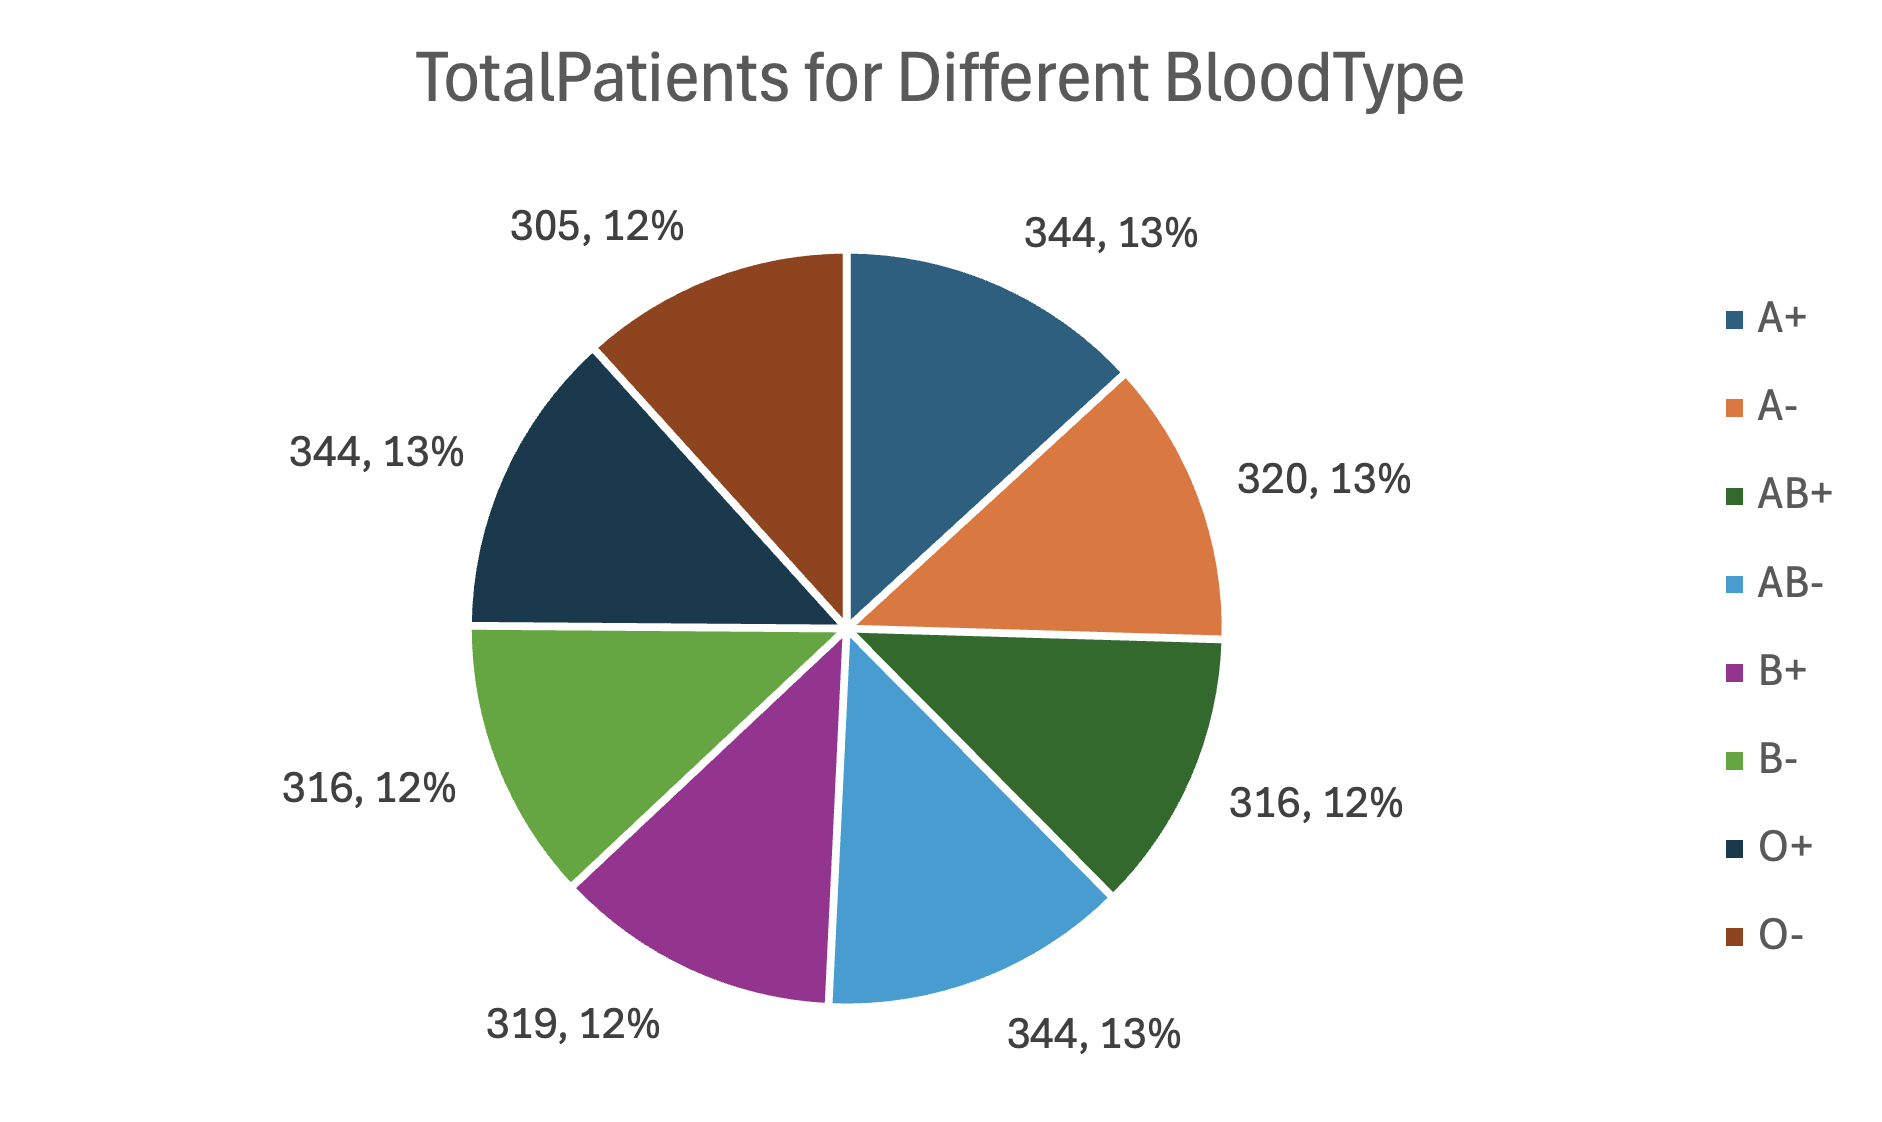
Total Patients for Different Blood Types
Page Focus: This page presents an analysis of various blood types in terms of patient numbers, average billing amounts, and gender distribution.
| Blood Type | Total Patients | Avg Billing Amount ($) | Male Count | Female Count |
|---|---|---|---|---|
| A+ | 344 | 25789.38 | 175 | 169 |
| A- | 320 | 25623.18 | 176 | 144 |
| AB+ | 316 | 25680.39 | 160 | 156 |
| AB- | 344 | 26053.77 | 183 | 161 |
| B+ | 319 | 25634.48 | 168 | 151 |
| B- | 316 | 24200.62 | 152 | 164 |
| O+ | 344 | 25291.63 | 159 | 185 |
| O- | 305 | 25634.99 | 151 | 154 |
Analysis: The number of patients across different blood types is fairly consistent, with no significant differences observed. This balance in the dataset ensures that each blood type contributes equally to the analysis, helping to avoid biases or errors that could arise from insufficient sample sizes when analyzing other variables related to blood types.
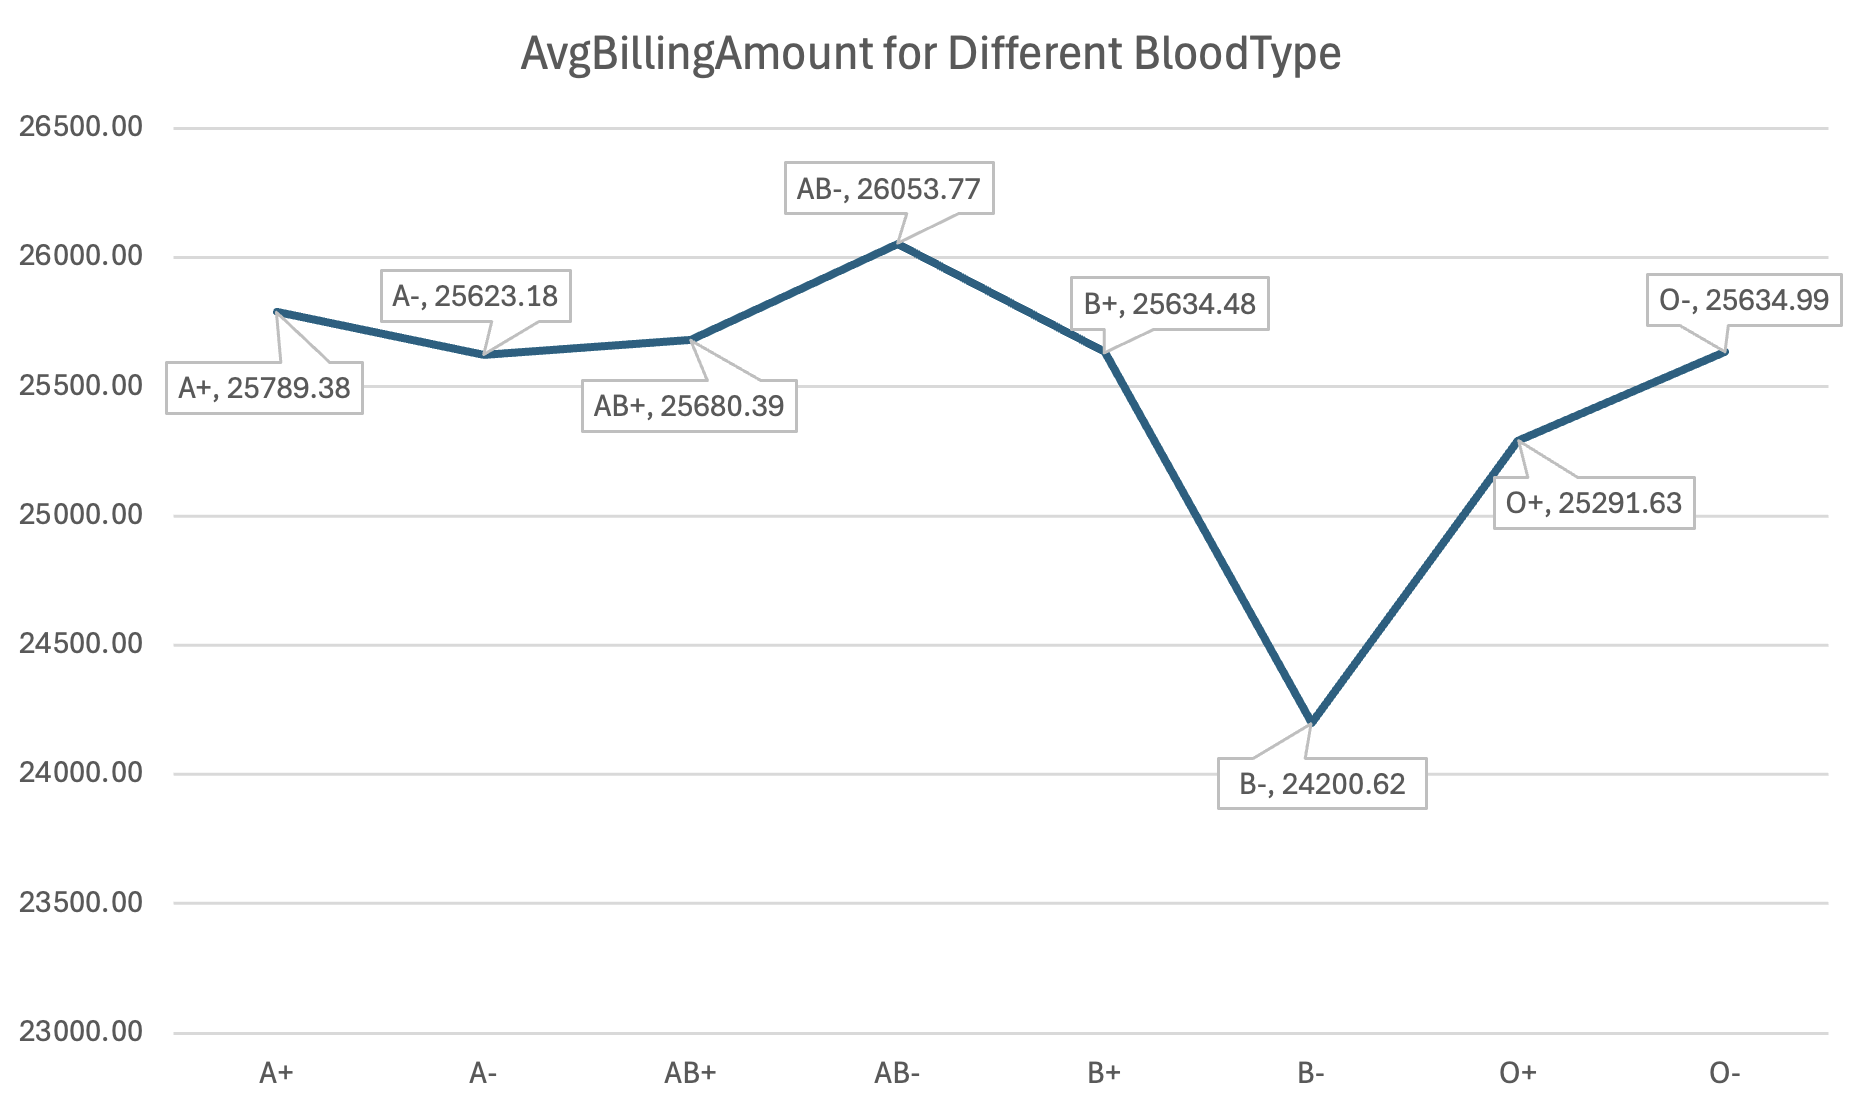
Analysis: B- has the lowest average billing amount, while the others are similar. This difference could be due to factors like medical conditions, and more analysis is needed.
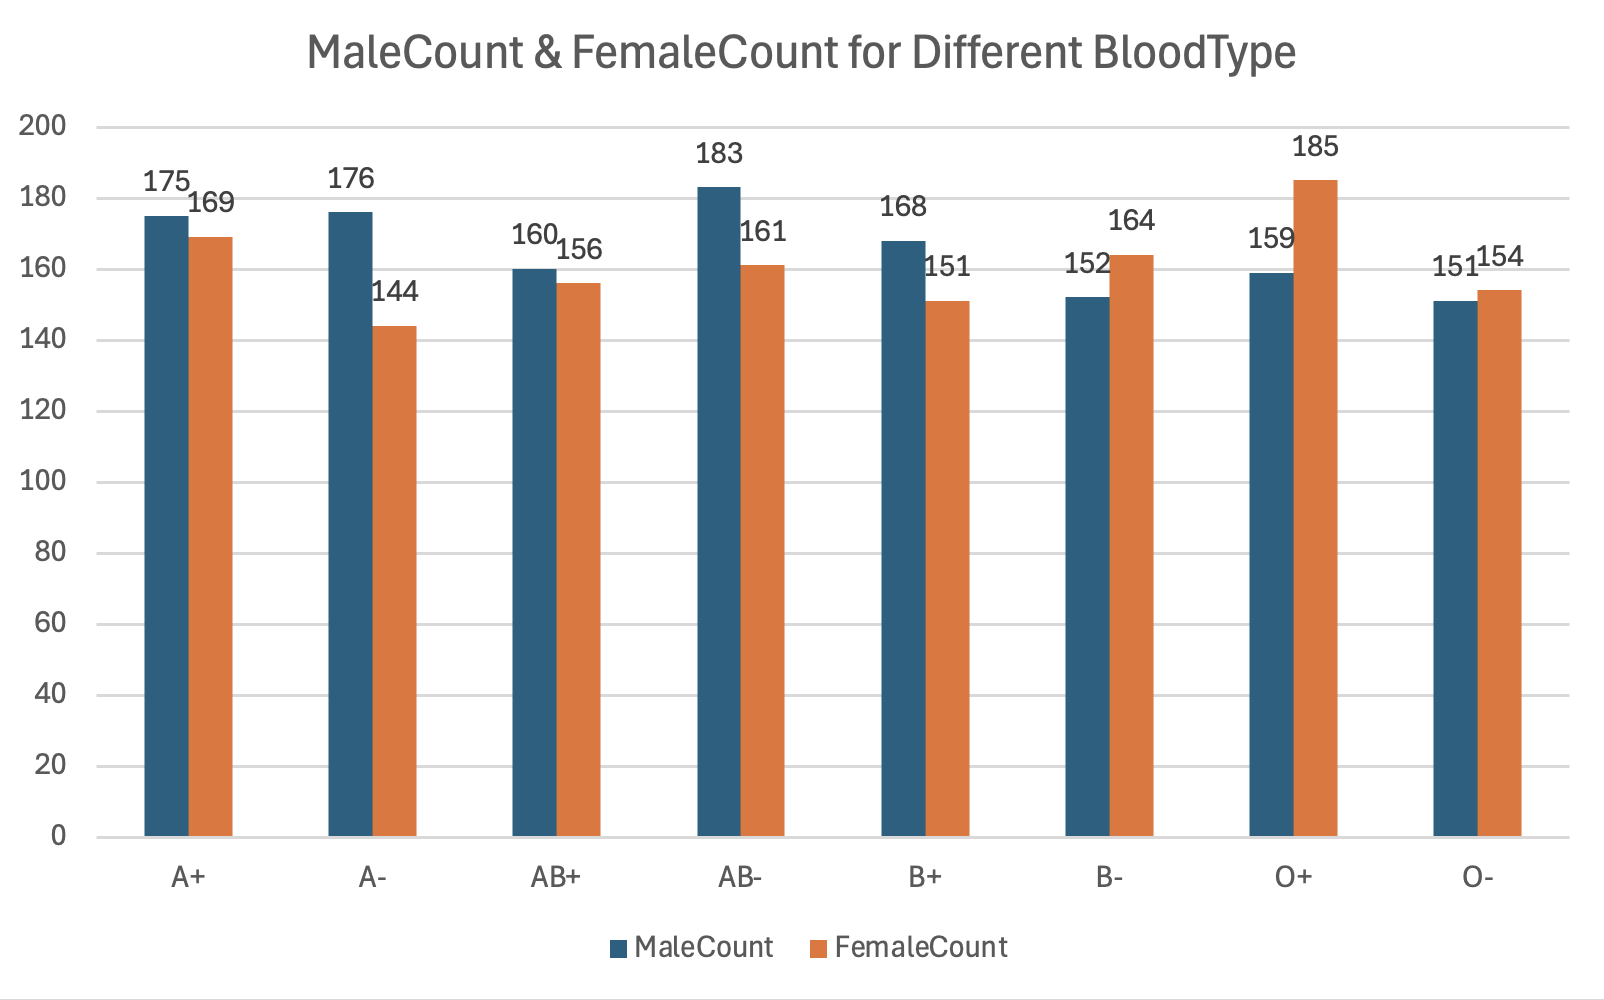
Analysis: The gender distribution is generally balanced across all blood types. However, B-, O+, and O- exhibit a slightly higher proportion of female patients compared to male patients.